

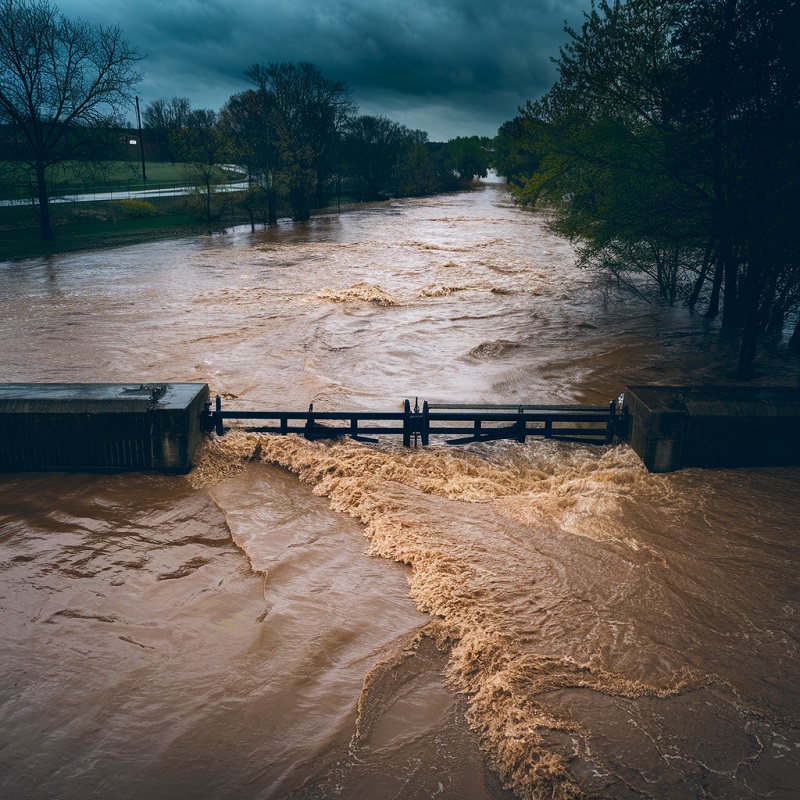
On April 7, 2025, the Ohio River hit 60 feet at Cincinnati’s riverfront—its highest in seven years. The National Weather Service flagged it early, but for many residents, the signs were already clear. Parks disappeared beneath muddy water. Floodgates lined the East End. Families hurried to raise furniture and stack sandbags. It wasn’t just another spring flood. This one had teeth.
While this surge is tied to recent rainfall, it points to a much larger story about weather patterns, infrastructure, and the risks of river living. Let’s unpack how we got here—and where we go from here.
Ohio River Water Level: How High Is Too High?
In Cincinnati, flood stage officially starts at 52 feet. When the Ohio River reaches 56 feet, flooding becomes moderate. But at 60 feet, the impact is serious: roads are cut off, neighborhoods flood, and river commerce comes to a halt. Though the floodwalls are designed for a monstrous 80 feet, that doesn’t mean we’re in the clear.
Most homes, businesses, and emergency plans just aren’t designed for water that high. What happened this April was a warning shot. It showed just how quickly things can shift.
Why the Ohio River Flooded in 2025: A Closer Look
So, what caused this flood? In just five days, a massive weather system dumped 4 to 7 inches of rain across the Ohio River watershed—a 204,000-square-mile region. Soils were already soaked. Tributaries like the Allegheny, Monongahela, and Muskingum funneled all that water straight into the main stem of the Ohio.
The Cincinnati USGS gauge (03255000) tracked the river climbing from a calm 26 feet to 60 feet. That’s a 34-foot rise in less than a week. The math is startling, but not unprecedented.
| Year | Crest (feet) |
| 1937 | 79.9 |
| 1997 | 64.7 |
| 2018 | 60.0 |
This year’s flood joins a shortlist of major events. And with climate shifts, it may not be long before we top it again.
How This Flood Compares to 2018 and 1937
The Ohio River has a long memory. In 1937, it flooded for nearly three weeks. The water reached almost 80 feet and changed the city forever. In response, Cincinnati built a flood defense system now known as the LFPP.
In 2018, the river climbed to 60 feet, much like this year. But in 2025, there’s a twist: more people, more pavement, and more runoff.
| Event Year | Water Level (ft) | Key Outcomes |
| 1937 | 79.9 | 19 days of flooding, massive damage |
| 1997 | 64.7 | Serious disruptions to infrastructure |
| 2018 | 60.0 | Major local flooding |
| 2025 | 60.0 | Widespread urban impact |
We’re building and expanding faster than ever. But with that comes vulnerability. The river reminds us of that every few years.
Is Climate Change Making Ohio River Flooding Worse?
Here’s what the data shows: the Midwest is getting wetter. NOAA reports a steady rise in both rainfall volume and frequency. When the atmosphere holds more moisture, storms dump more water.
That’s how we get:
- Bigger, faster runoff
- Overwhelmed storm drains
- Faster river rises with less warning
Scientists are careful not to pin every storm on climate change. But the trend is clear: the Ohio River is responding to a wetter, wilder world.
Ohio River Flood Impacts: How 60 Feet Changes Everything
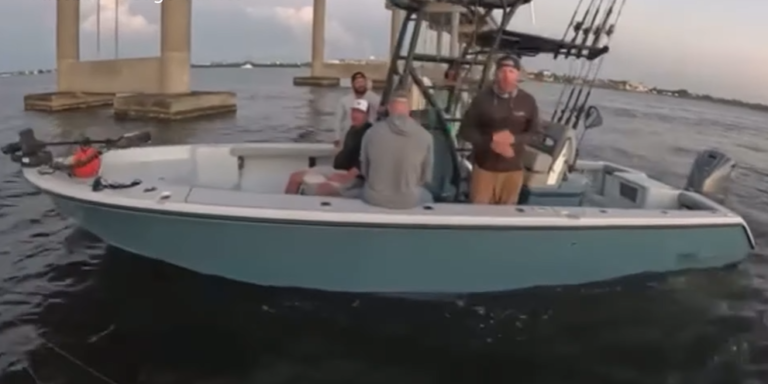
When the river hits 60 feet, it stops being scenery and starts being a serious threat. Neighborhoods flood, roads vanish, and boats can’t pass under bridges. Here’s how different areas were hit:
- Cincinnati East End: Basements filled. Sandbags became lifelines.
- New Richmond: Families evacuated as streets turned to rivers.
- Aurora, IN: Businesses closed, docks went under.
- Route 52 & Kellogg Avenue: Impassable for days.
Cincinnati’s floodwalls did their job—for now. But beyond those walls, damage piled up. River traffic was shut down. Barge shipments stalled. Losses are estimated in the hundreds of millions.
What Residents Can Do Now: Safety and Recovery Tips
Floods happen fast. Recovery moves slower. Here’s what to do:
Before the flood:
- Have an emergency kit ready
- Move belongings off basement floors
- Sign up for city alert systems
During the flood:
- Don’t drive through water—ever
- Turn off gas and electricity if you leave
- Stay connected via radio or mobile updates
After the flood:
- Take photos of damage
- File claims early
- Watch out for mold, downed lines, and contaminated water
Climate Connection: Is Global Warming Fueling the Ohio River?
You’ve probably heard it before: warmer air holds more water. That means more rain. And it’s showing up in the Ohio River.
Flooding patterns that used to happen once in 20 years are now happening every 5 to 10. That’s not just weather. That’s a changing climate at work.
The takeaway? We can’t afford to treat each flood as a surprise.
Flood Infrastructure: Strong But Aging
After 1937’s devastation, the Army Corps and the City of Cincinnati built the LFPP. It’s impressive:
- Walls that can handle 80-foot crests
- Pump stations and gates
- Coordination with upstream dams like Meldahl
But it’s also nearly 90 years old. With rising water and new development, it’s time for an upgrade. Sensors, smart pumps, and climate-aware zoning laws could make all the difference.
Social & Environmental Costs of Rising Ohio River Water Levels
Floods don’t hit everyone equally. Here’s the breakdown:
Environmental issues:
- Erosion and sediment choke fish habitats
- Pollutants wash from streets into the river
- Natural floodplains are paved over
Community impact:
- Lower-income areas suffer most
- Flood insurance gaps leave families stranded
- Mental stress grows with each flood season
“Every spring we wait and wonder,” said lifelong East End resident, Jane Connors. “How much water this time?”
Future Outlook: Short-Term Response and Long-Term Solutions
In the short term:
- Crews continue monitoring upstream dams
- FEMA and local services organize cleanup
- Roads reopen as water recedes
In the long term:
- Update flood defenses with new tech
- Use green infrastructure to slow runoff
- Rewrite zoning rules to keep homes out of harm’s way
- Educate residents via social media and school programs
Cities like Pittsburgh have already made big strides. Cincinnati can lead, too.
Real-Time Resources
- Live Water Level at Cincinnati Gauge: USGS Gauge 03255000
- Flood Forecast Maps: National Weather Service River Forecast Center
- ORSANCO Water Quality Updates: orsanco.org
What You Need to Know About the Ohio River Water Level
How high is too high?
Once the Ohio River hits 56 feet, flooding gets serious. At 60 feet, entire roads and neighborhoods go under.
How often does the river flood like this?
It’s becoming more frequent—especially with heavier rain patterns and continued development near floodplains.
Is climate change to blame?
It’s not the only cause, but it’s definitely making things worse by increasing rainfall intensity.
Can residents prepare?
Absolutely. Early warnings, flood kits, and smart home upgrades make a difference.
Where can I track river levels in real time?
Use the USGS or NWS sites listed above for up-to-date info.
Conclusion: The Ohio River’s Warning Shouldn’t Be Ignored
The Ohio River’s rise to 60 feet isn’t just another line on a chart. It’s a story of risk, resilience, and the urgent need to adapt. For now, the water is receding. But the message remains loud and clear.
This won’t be the last time the river rises. The real question is: will we be ready next time?
Use #OhioRiverFlood to share your story and help others stay prepared.